GBDA 303- A1
Map Box, Excel, Data Wrangling, Infographics
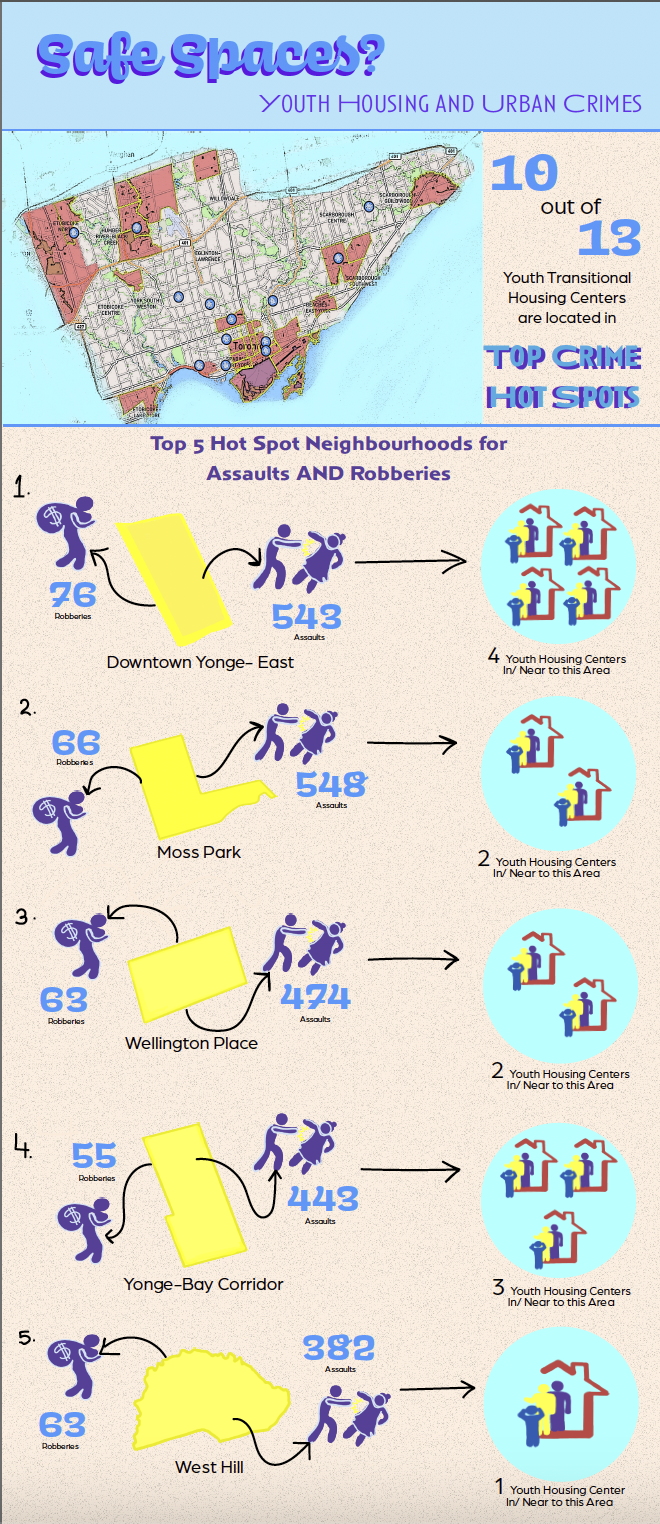
This project investigates the relationship between transitional youth housing locations (housing for homeless youth under the age of 24, both male and female) and the incidence of robberies and assaults in Toronto for the year 2022. By analyzing these two datasets, I aimed to uncover any patterns or trends that can help to enhance policy and overall safety in these areas.
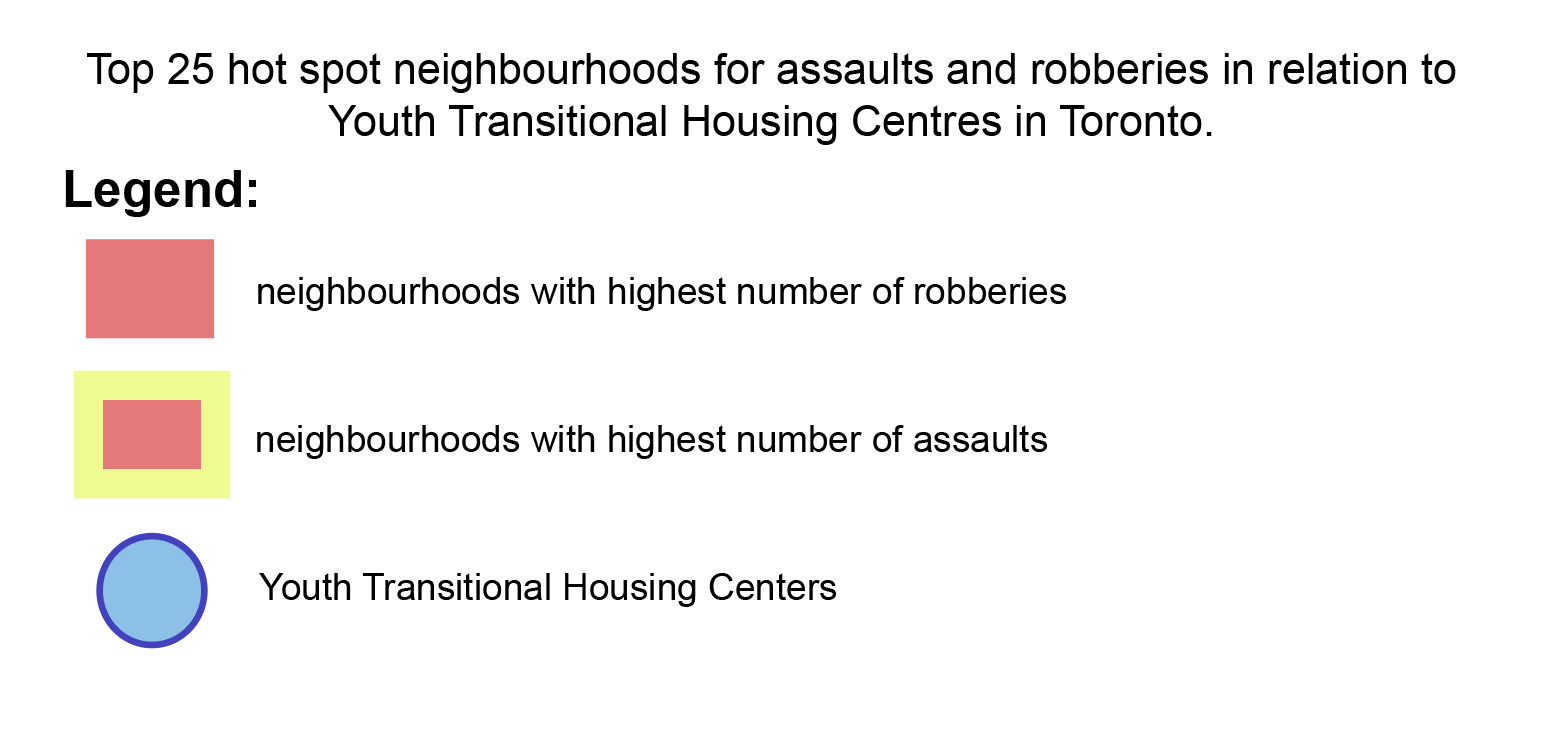
The main datasets were sourced from Toronto Open Data. The Transitional Housing Raw Dataset documented the locations of all the transitional housing centers in Toronto, along with data on the age groups, accessibility and if the centre catered to a specific demographic (gender-based, indigenous housing etc.). The Neighbourhood Crime Rates dataset published by the Toronto Police Service provided insight on the number of different crimes reported in specific locations in Toronto. To keep the visualized data findings concise, I focused on the top 25 neighbourhoods in Toronto with the most assaults and robberies recorded.
Through the analysis, it was found that 24 out of 25 top hot spots for assaults and robberies in Toronto coincided, indicating that almost all of the same neighbourhoods experienced the highest incidences of these crimes. Notably, 10 out of the 13 Transitional Housing Centers were located within these hotspot crime neighbourhoods. This suggests that neighbourhoods with Transitional Housing facilities tend to have a higher rate of assaults and robberies. One hypothesis could be that the presence of these vulnerable populations may inadvertently attract criminal activity to these areas. Contrarily, it is possible that these neighbourhoods were already experiencing high assault and robbery rates before the establishment of these youth transitional housing centers, which were built in these areas due to lower property costs and available infrastructure. However, it is important to note that there is no concrete evidence to support a direct correlation between the presence of these facilities and the assaults and robberies committed in these areas.
Nonetheless, the findings indicate a need for more targeted security and safety measures in these specific neighbourhoods. Additionally, according to Charron(2024), robberies and serious assaults are the top two crimes committed by youth in Toronto. This underscores the importance of focusing on youth crime prevention and intervention strategies in Toronto. Whilst, the findings point to a correlation between the location of Transitional Housing Centers and higher rates of assaults and robberies, the relationship between them is multifaceted and complex.
The infographic design focuses on making the data visually accessible. By using distinct colours and maps, I was able to show clear differentiate between housing locations and the different crime incidents. For my Map box maps, I used a pale red fill to represent the top neighbourhoods with the highest number of robberies reported. As many of the top 25 neighbourhoods for robberies and assaults coincided with each other, in an effort to differentiate between them, I used a bold yellow outline on the top 25 neighbourhoods that reported the highest number of assaults. To illustrate the location of the Youth Transitional Housing Centers, I used a light blue circle with a bold dark blue stroke to clearly indicate the location. The colour choice for this was intentional as light/pale blues are associated with innocence and youth, which I though represented the the Youth Transitional Housing Centers in a positive light, freeing it from harsh connotations. The map provides a spatial overview, while the charts offer detailed statistical insights. For my infographic specifically, I wanted to keep it simple and easy to understand, opting for simple symbols to represent robbery and assault drawn on Procreate and put into Adobe Illustrator.
In terms of real world applications, Urban planners and social services can use these insights to enhance safety measures around transitional housing facilities. Law enforcement agencies might also focus on these areas for targeted crime prevention initiatives, ensuring a safer environment for homeless youth or put initiatives in place to combat the crime in these areas.
References:
Anon. 2024. Open data dataset. (January 2024). Retrieved June 1, 2024 from https://open.toronto.ca/dataset/neighbourhood-crime-rates/
Anon. 2022. Open data dataset. (April 2022). Retrieved June 1, 2024 from https://open.toronto.ca/dataset/wellbeing-youth-transitional-housing/
Charron, M. (2024). Research paper. Crime and Justice Research Paper Series Neighbourhood Characteristics and the Distribution of Crime in Toronto: Additional Analysis on Youth Crime. Retrieved June 17, 2024, from https://www150.statcan.gc.ca/n1/en/pub/85-561-m/85-561-m2011022-eng.pdf?st=88Zjlj3r